B4SNI Logs - SNI Traffic Monitor
What is B4SNI Logs?
B4SNI Logs is a network monitoring feature in XRAYUI that captures and displays Server Name Indication (SNI) information from your network traffic. SNI is the hostname that devices request when making HTTPS connections, allowing you to see which websites and services are being accessed through your network.
How to Use
Starting the Monitor
- Navigate to the B4SNI Logs section in your
XRAYUIinterface (very bottom of the main screen)
- Click the start button to begin capturing SNI data
- The button will change to Stop when the service is running
Viewing Logs
- Click the display button to open the log viewer
- Logs will automatically refresh every 3 seconds while the window is open
View Modes
The log viewer provides three different tabs to analyze your traffic:
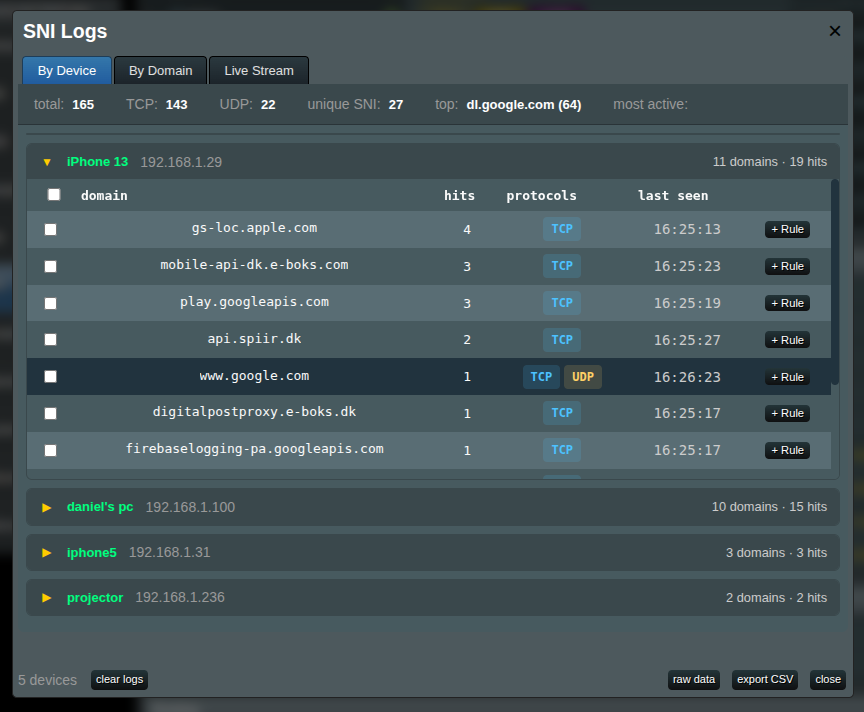
By Device
Groups all captured domains by the LAN device that accessed them. Each device appears as a collapsible card showing:
- Device name (or IP address if unrecognized) and total hit count
- A table of all domains accessed by that device
- Per-domain hit count, protocol badges, and last seen time
- + Rule button on each domain row to quickly add it to a routing rule
Cards are sorted by total hits, so the most active devices appear first.
By Domain
An aggregated table showing all captured domains across all devices, sorted by hit count:
| Column | Description |
|---|---|
| Domain | The SNI domain name |
| Hits | Total number of connections to this domain |
| Protocols | TCP (blue) and/or UDP (yellow) badges |
| Devices | Tags showing which devices accessed this domain |
| Last Seen | Timestamp of the most recent connection |
| Action | + Rule button to add the domain to a routing rule |
Use the search box to filter domains by name.
Live Stream
The real-time log view showing individual connection events in reverse chronological order. Each entry shows:
| Field | Description |
|---|---|
| Time | When the connection was made (HH:MM:SS format) |
| Protocol | Either TCP (blue badge) or UDP (yellow badge) |
| Source | The device making the connection — shows device name if recognized, otherwise IP address, plus the port number |
| Destination | The server being connected to (IP:port) |
| SNI | The domain name being accessed (e.g., google.com, netflix.com) |
Use the per-column search boxes to filter by Protocol, Source, Destination, or SNI.
Statistics Bar
At the top of the log viewer, you'll see:
- Total: Total number of connections logged
- TCP/UDP: Breakdown by protocol type
- Unique SNI: Number of different domains accessed
- Top Domain: The most frequently accessed domain and its hit count
- Most Active Device: The device with the most connections
Adding Domains to Routing Rules
You can add domains directly from SNI logs to your Xray routing rules without leaving the log viewer:
- Click the + Rule button next to any domain
- A popover will appear listing your existing routing rules
- Select an existing rule to add the domain to, or choose New rule and provide a rule name and outbound tag
- Click Confirm to add the domain
Bulk Selection
In the By Device and By Domain views, you can select multiple domains at once:
- Use the checkbox next to each domain to select it individually
- In By Device view, use the device-level checkbox to select all domains for a device
- In By Domain view, use the top checkbox to select all visible domains
- When domains are selected, a bulk action bar appears — click Add selected to rule to add them all at once
Managing Logs
- Clear Logs: Click to remove all captured logs and start fresh
- Export CSV: Download the current view as a spreadsheet file. The exported columns depend on the active tab:
- Live Stream: Time, Protocol, Source IP, Source Port, Device, Dest IP, Dest Port, SNI
- By Domain: Domain, Hits, Protocols, Devices, First Seen, Last Seen
- By Device: Device, IP, Domain, Hits, Protocols
- Raw: View the raw log file in a new browser tab
Stopping the Monitor
Click the stop button when you're done monitoring to conserve system resources.
Privacy Note
B4SNI Logs only captures the domain names (SNI), not the actual content of your internet traffic. It's like seeing the address on an envelope without opening the letter.
Troubleshooting
No Logs Appearing
- Make sure the service is started (
startbutton clicked) - Wait a few seconds for traffic to be captured
- Try refreshing the page
- Check if there's actual network activity
Device Names Not Showing
- Device names only appear for recognized devices on your network
- New devices may take time to be identified
- Guest devices might only show IP addresses
Service Won't Start
- Another monitoring service might be running
- Try stopping and starting again
- Refresh the XRAYUI interface
Logs Growing Too Large
- The system automatically limits log file size and rotates logs
- Use "Clear Logs" periodically to start fresh
- Export important logs before clearing
Frequently Asked Questions
Q: Does this slow down my internet?
A: No, B4SNI Logs operates passively and doesn't impact network performance.
Q: Can I see what people are browsing? A: You can see domain names (like youtube.com) but not specific pages or content.
Q: How long are logs kept?
A: Logs are kept until you clear them or restart the service. The system automatically manages file size.
Q: Can I monitor specific devices only?
A: All traffic is monitored, but you can use the By Device tab to focus on a specific device, or use filters in Live Stream to view traffic from a particular source.
Q: Can I add monitored domains to routing rules?
A: Yes! Use the + Rule button on any domain row, or select multiple domains and use bulk add. This lets you quickly build routing rules based on real traffic you observe.